
Deep down, I think we all love statistics. We love keeping track of endless numbers and using them to judge success or failure. Me personally, I love baseball statistics.
Let me give you some examples.
As manager of the Chicago Cubs, Lou Pinella is 0-6 in the postseason, a stellar .000 winning percentage
The Cubs have been outscored 36-12 in those 6 games
In the 2008 NLDS against the Dodgers:
The Cubs were 5 for 28 (.178) with runners in scoring position
Alfonso Soriano, the Cubs “best” player, was 1 for 14 (.071) with 0 runs scored, 0 walks, 0 RBIs, and 4 Strikeouts.
Manny Ramirez, everybody knows Manny, was 5 for 10 (.500) with 5 runs scored, 4 walks (for a .642 On-base Percentage), 3 RBIs, and 3 Strikeouts.
Judging from these statistics, it’s easy to see that the Cubs didn’t produce much offense during the 2008 baseball playoffs. For the 100th consecutive year, Cubs fans will sigh and say “Maybe next year” as the Cubs last won the World Series in 1908. I thought there was a great chance for a Cubs vs. Red Sox series this year, oh well…
What does this have to do with Citrix? Good question.
There may come a time when you want to know the performance statistics of your Citrix servers. How well are my Citrix servers performing? Do I have an Alfonso Soriano that can service two concurrent ICA connections before it crashes or a Manny Ramirez which is running the entire datacenter without breaking a sweat?
Most shops with a substantial XenApp infrastructure will use EdgeSight to collect this data. Maybe some shops use the eG Citrix Monitor, or if you have XenApp Enterprise Edition, perhaps you use Resource Manager.
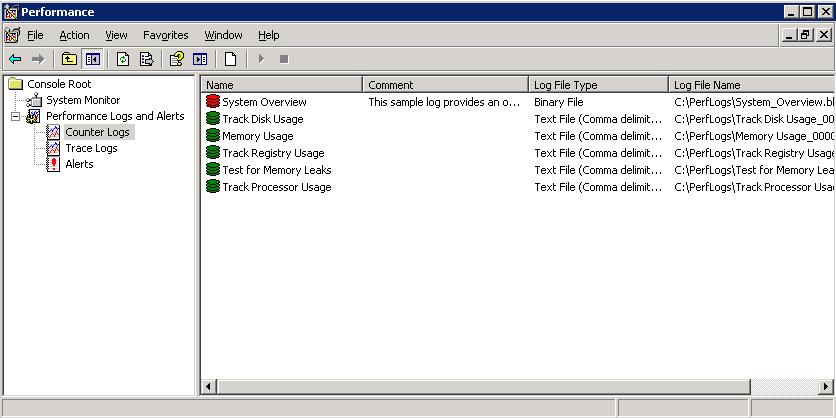
What if you’re forced to use Windows Performance Monitor? Every XenApp Server has a user connection limit; and Performance Monitor can help you track the following:
• Memory Usage
• Test for Memory Leaks
• Processor Usage
• Disk Usage
• Registry Quota Limit
Let me take a moment to stress how important it is to run the Performance Counters on a fairly consistent basis. It’s vital to have a good working baseline, otherwise you may not know how big or small a particular problem may be. When a performance degradation occurs, run the monitors and compare the data to the working baseline to get a more complete picture of what’s going on.
Memory Usage
Memory is widely acknowledged to be the most important hardware component of a Presentation Server as the amount of memory completely affects the performance of other hardware components. Not having enough memory in a Presentation Server would add an extra burden to the processor and hard disk since the page file would be used more often and would severely limit the number of users a server could support.
The following counters are used to track memory usage trends:
Memory | Available Mbytes
This counter tracks the amount of megabytes free in physical memory. Free memory, of course, is memory which is ready to be used by another process.
Memory | Pages Input/Sec
This counter tracks the number of times per second that a particular process needed to access a piece of memory not in it’s working set, meaning it had to be retrieved from the page file.
Ideally, the average should be less than 65.
Memory | Pages Output/Sec
This counter tracks the number of times per second that the server decided to trim a process’s working set by writing some memory to disk to free up physical ram for another process.
Like Pages Input/Sec, the average should be less than 65.
Test for Memory Leaks
Typically, identifying a memory leak is an easy process. Monitor the following items:
Memory | Paged Pool Bytes
Paging File | %Usage | _Total
If either or both of these counters increases without adding users to the server, then a memory leak is likely to blame.
Processor Usage
Processor Usage is tracked using the following counters:
Processor | % Processor Time | _Total
This, naturally, show how busy the processor(s) are. If % Processor Time is consistently 100%, it means you need more of something, not necessarily processing power. A processor could peg at 100% if a system is running out of memory and moves data to and from the page file.
If this counter consistently registers higher than 85%, the server’s processor is too busy.
System | Processor Queue Length
This counter tracks how many requests are backed up while they wait for the processor to get freed up. By using this counter, you can identify a processor that is busy versus a processor that is too busy.
This counter should average to be less than 15.
Disk Usage
On a Presentation Server, hard drives are rarely the bottleneck but their performance should be checked nonetheless. To monitor hard drive performance, use the following counters:
Physical Disk | % Disk Time
This tracks how busy the server’s hard drives are. A consistent high value, greater than 80%, may indicate your server needs faster drives, more memory or fewer users.
Physical Disk | Current Disk Queue Length
This counter tracks how many disk requests are waiting because the hard disk is too busy and should average 3 or less.
Registry Quota Limit
When running Presentation Server, it is conceivable that a server may be unable to host additional user sessions if the registry runs out of space. Using Performance Monitor, it is easy to check for this issue.
Use the following counter to check:
System | % Registry Quota in Use
This counter displays the percentage of your server’s registry that’s currently in use. If this counter indicates you are approaching 100%, you should consider increasing the Maximum registry size setting.
These are the performance monitoring counters I have found beneficial, I’m certainly not declaring it an all-inclusive list so if you have had success with others, let me know.
GO CUBS!!….maybe next year 🙂
